S&P 500 DCA Calculator: Dollar Cost Averaging vs Lump Sum
Replay monthly S&P 500 investing since 1928 with dividends. Compare dollar cost averaging with investing the same money as a lump sum.
Investment Parameters
LiveEvery field editable at a glance, no tabs
Instant answer
If you invest $500/month for 20 years at a 10% annual return, you could reach about $382,848.
In today's money, at 2.5% inflation a year, that's worth about $233,641.
You put in $120,000. Interest earned adds about $262,848.
Millionaire path
To aim for $1,000,000 in 20 years, try about $1,317/month.
Your projected total
$382,848
After 20 years at a 10% annual return
Total Invested
$120,000
Your contributions
Interest earned
$262,848
219.04% return
Total Fees Paid
$0
You could lose $0 to fees over 20 years.
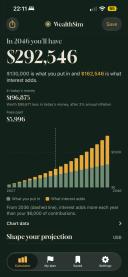
WealthSim for iPhone
Take your projections with you
Now with My plan, free with no account, and 100 futures from real market years in Pro.
Launch offer until November 15: Pro for the price of one month the first year.
Scan to open these numbers on your iPhone
Purchasing Power Analysis
Worth in today's purchasing power:
$233,641
This is what your final balance would be worth in today's money
Nominal value in future dollars:
$382,848
In 20 years at 2.5% annual inflation
Why the difference? Due to 2.5% inflation, your $382,848 in 20 years will have the same purchasing power as $233,641 today. This means goods and services that cost $233,641 today will cost $382,848 in the future.
Wealth Growth
Investment growth report
Printed on
Assumptions
- Initial deposit
- $0
- Monthly contribution
- $500
- Time horizon
- 20 years
- Annual return (nominal)
- 10.00%
- Annual management fee
- 0.00%
- Inflation
- 2.50%
- Currency
- USD
Key results
- Final balance
- $382,848
- Total invested
- $120,000
- Total growth
- $262,848
| Year | Invested | Balance |
|---|---|---|
| Year 0 | $0 | $0 |
| Year 1 | $6,000 | $6,335 |
| Year 2 | $12,000 | $13,334 |
| Year 3 | $18,000 | $21,065 |
| Year 4 | $24,000 | $29,606 |
| Year 5 | $30,000 | $39,041 |
| Year 6 | $36,000 | $49,464 |
| Year 7 | $42,000 | $60,979 |
| Year 8 | $48,000 | $73,700 |
| Year 9 | $54,000 | $87,752 |
| Year 10 | $60,000 | $103,276 |
| Year 11 | $66,000 | $120,426 |
| Year 12 | $72,000 | $139,371 |
| Year 13 | $78,000 | $160,300 |
| Year 14 | $84,000 | $183,420 |
| Year 15 | $90,000 | $208,962 |
| Year 16 | $96,000 | $237,178 |
| Year 17 | $102,000 | $268,349 |
| Year 18 | $108,000 | $302,784 |
| Year 19 | $114,000 | $340,825 |
| Year 20 | $120,000 | $382,848 |
Replay monthly S&P 500 investing and compare it with a lump sum
This DCA calculator uses actual S&P 500 returns from 1928 to 2025, with dividends reinvested. It covers the index only, not crypto or single stocks. Pick a monthly amount and a range to see what steady buying would have produced, and what the same money would have become if you had invested it all at the start. To project forward with your own return assumption, use the S&P 500 calculator.
S&P 500 dollar cost averaging vs lump sum
2000–2025: $500 a month, $156,000 invested in total. The lump sum puts the same $156,000 in at the start of 2000.
Nominal values, dividends reinvested
- Dollar cost averaging
- $854,513
- $156,000 invested
- Lump sum at the start
- $1,152,152
- 7.99% annualized index return
The lump sum ended $297,639 higher over this range. Price only, without dividends, the monthly plan would have ended at $637,468.
View year-by-year table
| Year | DCA balance | Lump-sum balance | DCA invested so far |
|---|---|---|---|
| 2000 | $5,702 | $141,910 | $6,000 |
| 2001 | $10,634 | $125,094 | $12,000 |
| 2002 | $13,557 | $97,616 | $18,000 |
| 2003 | $24,288 | $125,296 | $24,000 |
| 2004 | $33,241 | $138,756 | $30,000 |
| 2005 | $41,004 | $145,464 | $36,000 |
| 2006 | $53,902 | $168,175 | $42,000 |
| 2007 | $63,035 | $177,399 | $48,000 |
| 2008 | $44,724 | $112,556 | $54,000 |
| 2009 | $63,136 | $141,747 | $60,000 |
| 2010 | $78,965 | $162,756 | $66,000 |
| 2011 | $86,690 | $166,171 | $72,000 |
| 2012 | $106,971 | $192,576 | $78,000 |
| 2013 | $148,357 | $254,480 | $84,000 |
| 2014 | $174,853 | $288,897 | $90,000 |
| 2015 | $183,308 | $292,881 | $96,000 |
| 2016 | $211,265 | $327,362 | $102,000 |
| 2017 | $263,592 | $398,090 | $108,000 |
| 2018 | $258,312 | $381,263 | $114,000 |
| 2019 | $345,907 | $500,262 | $120,000 |
| 2020 | $414,822 | $590,425 | $126,000 |
| 2021 | $539,807 | $758,513 | $132,000 |
| 2022 | $447,835 | $621,696 | $138,000 |
| 2023 | $571,361 | $783,715 | $144,000 |
| 2024 | $720,289 | $978,692 | $150,000 |
| 2025 | $854,513 | $1,152,152 | $156,000 |
Annual returns spread evenly across months, with deposits at the start of each month. Excludes fees and taxes. Past returns do not predict future returns.
Does dollar cost averaging beat a lump sum?
Usually not, on paper. Across the 89 ten-year windows from 1928–1937 to 2016–2025, investing the whole amount at the start ended higher in 82. Monthly investing ended higher in 7. The index rose in most years, so money invested earlier had more time to grow.
DCA wins when a fall comes early. From 2000 to 2009, $500 a month grew to $63,136, while the same $60,000 invested in January 2000 ended at $54,518.
If you invest from each paycheck, you are already doing DCA: the money goes in as soon as you have it. The choice only matters when you already hold a large sum. The windows above favor investing it at once. Spreading it over a few months gives up some expected return in exchange for less regret if a crash follows.
How this DCA calculator works
Each year's S&P 500 return comes from the dataset named under the results and is spread evenly over twelve months. Deposits land at the start of each month. The lump sum goes in at the start of the first year. The inflation toggle deflates every balance and each deposit using the dataset's annual US inflation figures.
Results exclude fees, taxes and trading costs. Annual data also smooths falls inside a year, such as March 2020, so the real month-by-month path was bumpier than the table. For an index fund's costs, try the VOO calculator.
Related guides
Built and maintained by Oscar Gallego Ruiz. Historical data through 2025. Methodology and sources.
Disclaimer: WealthSim is an independent educational tool for financial simulation and is not affiliated with any financial institution, including Wealthsimple. All calculations are for educational purposes and do not constitute financial advice.
Frequently Asked Questions
What is a DCA calculator?
Is dollar cost averaging better than investing a lump sum?
What would $500 a month in the S&P 500 since 2000 be worth?
Does this DCA calculator work for Bitcoin or single stocks?
Try the Free Calculator
Enter your own numbers. No account required.
Open CalculatorRelated Calculators
Compare other holding periods, contributions and returns.
Compound Interest: Monthly, Daily & With Fees
Calculate compound interest with monthly contributions, fees, inflation, and taxes. Compare daily, monthly, and annual compounding for your savings goals.
S&P 500: Total Return, Growth & Investment Simulator
Free S&P 500 calculator: project $10,000 or monthly contributions with dividends reinvested and inflation-adjusted returns.
S&P 500 Index Funds Compared: FXAIX, VFIAX, SWPPX, VOO
Compare FXAIX, VFIAX, SWPPX, VOO, IVV and SPY: sourced expense ratios, minimums and the dollar fee gap on real S&P 500 returns since 1928.