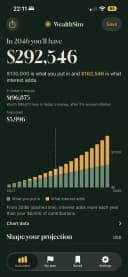
$500 a month put into the S&P 500 from January 1996 grew to $1,148,110 by the end of 2025, with dividends reinvested. You would have put in $180,000 of your own money. Over 20 years, from 2006, the same $500 a month became $529,742, 4.4 times what went in.
These are not projections. They replay the index's actual annual returns from Aswath Damodaran's dataset at NYU Stern, with each deposit made at the start of the month. No fund fees, no taxes, and no stopping when the market fell.
$500 a month after 10, 20 and 30 years
| Invested for | You put in | With dividends | Price only | After inflation |
|---|---|---|---|---|
| 10 years (from 2016) | $60,000 | $133,404 | $121,963 | $97,316 |
| 20 years (from 2006) | $120,000 | $529,742 | $423,382 | $321,534 |
| 30 years (from 1996) | $180,000 | $1,148,110 | $816,869 | $543,537 |
The 20-year run includes 2008, when the index lost more than a third of its value. Someone buying every month through that year bought cheap shares, and those shares did much of the work in the recovery. Dividends matter too: over 30 years, price alone would have come to $816,869.
The "after inflation" column is in dollars of the first year. Inflation also shrinks what the deposits are worth, so $500 in 1996 was a bigger sum than $500 today.
$100, $250, $1,000 or $2,000 a month
| A month | 10 years (from 2016) | 20 years (from 2006) | 30 years (from 1996) |
|---|---|---|---|
| $100 | $26,681 | $105,948 | $229,622 |
| $250 | $66,702 | $264,871 | $574,055 |
| $500 | $133,404 | $529,742 | $1,148,110 |
| $1,000 | $266,807 | $1,059,483 | $2,296,219 |
| $2,000 | $533,615 | $2,118,966 | $4,592,438 |
The result scales with the deposit: twice the monthly amount, twice the ending balance. To try your own amount or years, open the S&P 500 calculator with $500 a month over the same 20 years and change the inputs.
Can monthly investing lose money over 20 years?
Rarely, and only after inflation. Since 1928 there have been 79 windows of 20 calendar years. In 3 of them, $500 a month ended up worth less in real terms than the money that went in. The worst was 1955 to 1974, when the balance ended about 5% below what the deposits had cost, after inflation. The 1970s inflation did that, with the 1973-74 crash at the very end. The best was 1980 to 1999, when the balance reached 6.0 times the cost of the deposits, after inflation.
In dollars, none of those windows lost money. The risk with a 20-year horizon is less a crash than a decade of high inflation right before you need the money.
For a single sum instead of monthly deposits, see if you invested $10,000 in the S&P 500 20 years ago. For every year's return, see S&P 500 historical returns.
Questions
How much will I have if I invest $500 a month in the S&P 500 for 30 years?
Over the last 30 years it would have grown to about $1,148,110, from $180,000 of deposits made from January 1996 to December 2025, with dividends reinvested. That is history, not a forecast; the next 30 years can be better or worse.
What about 20 years?
$500 a month from 2006 to the end of 2025 became about $529,742 on $120,000 invested.
How much would $1,000 a month in the S&P 500 be worth after 20 years?
About $1,059,483 over the last 20 years, on $240,000 of deposits, with dividends reinvested. The result scales with the deposit, so it is twice the $500 figure.
Has investing monthly in the S&P 500 ever lost money over 20 years?
Not in dollars. After inflation it happened in 3 of the 79 20-year windows since 1928; the worst was 1955 to 1974, which ended in the high inflation and the crash of the mid-1970s.
Where to go next
- Replay any start year and monthly amount: S&P 500 calculator
- Compare monthly investing with a lump sum: DCA calculator
- Compare with keeping the money in savings: S&P 500 vs high-yield savings
How we calculate: methodology and sources.
Past returns don't guarantee future results. This article is educational and is not financial advice.