VTI Calculator: Vanguard Total Stock Market ETF
Project VTI growth with monthly contributions and see what its 0.03% fee saves against its peer-group average over 10, 20 and 30 years.
Investment Parameters
LiveEvery field editable at a glance, no tabs
Instant answer
If you invest $1,000 upfront and $500/month for 20 years at a 10% annual return, you could reach about $388,634.
In today's money, at 2.5% inflation a year, that's worth about $237,172.
You put in $121,000. Interest earned adds about $267,634.
Millionaire path
To aim for $1,000,000 in 20 years, try about $1,307/month.
Your projected total
$388,634
After 20 years at a 10% annual return
Total Invested
$121,000
Your contributions
Interest earned
$267,634
221.19% return
Total Fees Paid
$802
You could lose $802 to fees over 20 years.
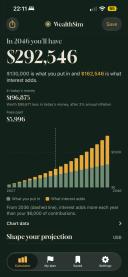
WealthSim for iPhone
Take your projections with you
Now with My plan, free with no account, and 100 futures from real market years in Pro.
Launch offer until November 15: Pro for the price of one month the first year.
Scan to open these numbers on your iPhone
Purchasing Power Analysis
Worth in today's purchasing power:
$237,172
This is what your final balance would be worth in today's money
Nominal value in future dollars:
$388,634
In 20 years at 2.5% annual inflation
Why the difference? Due to 2.5% inflation, your $388,634 in 20 years will have the same purchasing power as $237,172 today. This means goods and services that cost $237,172 today will cost $388,634 in the future.
Wealth Growth
Investment growth report
Printed on
Assumptions
- Initial deposit
- $1,000
- Monthly contribution
- $500
- Time horizon
- 20 years
- Annual return (nominal)
- 10.00%
- Annual management fee
- 0.03%
- Inflation
- 2.50%
- Currency
- USD
Key results
- Final balance
- $388,634
- Total invested
- $121,000
- Total growth
- $267,634
| Year | Invested | Balance |
|---|---|---|
| Year 0 | $1,000 | $1,000 |
| Year 1 | $7,000 | $7,439 |
| Year 2 | $13,000 | $14,549 |
| Year 3 | $19,000 | $22,402 |
| Year 4 | $25,000 | $31,075 |
| Year 5 | $31,000 | $40,653 |
| Year 6 | $37,000 | $51,231 |
| Year 7 | $43,000 | $62,912 |
| Year 8 | $49,000 | $75,813 |
| Year 9 | $55,000 | $90,061 |
| Year 10 | $61,000 | $105,796 |
| Year 11 | $67,000 | $123,174 |
| Year 12 | $73,000 | $142,365 |
| Year 13 | $79,000 | $163,560 |
| Year 14 | $85,000 | $186,966 |
| Year 15 | $91,000 | $212,817 |
| Year 16 | $97,000 | $241,365 |
| Year 17 | $103,000 | $272,893 |
| Year 18 | $109,000 | $307,713 |
| Year 19 | $115,000 | $346,166 |
| Year 20 | $121,000 | $388,634 |
Project VTI contributions and see what a low fee is worth
VTI is Vanguard's total US stock market ETF. It tracks the Morningstar US Total Market Index and held 3,507 stocks as of 2026-08-31. This calculator starts at a 10% yearly return before fees, the long-run S&P 500 figure the site uses elsewhere, and Vanguard's 0.03% expense ratio. It is an assumption, not a VTI forecast. To replay real index history, use the S&P 500 calculator.
VTI fees vs the average comparable fund
Vanguard's VTI page lists a Lipper peer-average expense ratio of 0.969% for funds in the same group. The table keeps contributions and the gross return equal and changes only the fee, so the last column is what the fee difference alone would cost.
| Years | VTI (0.03%) | Peer average (0.969%) | VTI advantage |
|---|---|---|---|
| 10 | $105,796 | $100,147 | $5,649 |
| 20 | $388,634 | $343,745 | $44,889 |
| 30 | $1,151,995 | $942,252 | $209,743 |
Monthly compounding with start-of-month deposits. Monthly fees are deducted from the balance before growth. Nominal values, before taxes, trading costs and tracking differences.
Both ratios from Vanguard's VTI page, retrieved 2026-09-27: VTI's expense ratio as of 2026-04-28; the Lipper peer-average expense ratio as of 2025-12-31.
VTI vs VOO
Fees do not separate them: both charge 0.03%. VOO tracks the S&P 500, about 500 large US companies. VTI adds mid-sized and small companies, 3,507 stocks in all.
Choose VTI if you want the whole US market in one fund, VOO if you only want the S&P 500. Neither choice predicts which will return more. See VOO vs VTI for returns, yield and holdings side by side, or the VOO calculator to compare VOO with IVV and SPY.
VTI dividends
Vanguard reported a 1.05% dividend yield and a 1.01% SEC yield as of 2026-08-31, retrieved 2026-09-27. VTI pays quarterly. The 10% starting assumption already includes reinvested dividends, so do not add the yield on top.
Related guides
Built and maintained by Oscar Gallego Ruiz. Historical data through 2025. Methodology and sources.
Disclaimer: WealthSim is an independent educational tool for financial simulation and is not affiliated with any financial institution, including Wealthsimple. All calculations are for educational purposes and do not constitute financial advice.
Frequently Asked Questions
What is VTI's expense ratio?
Is VTI or VOO better?
Does VTI pay dividends?
What return does this VTI calculator assume?
Try the Free Calculator
Enter your own numbers. No account required.
Open CalculatorRelated Calculators
Compare other holding periods, contributions and returns.
Compound Interest: Monthly, Daily & With Fees
Calculate compound interest with monthly contributions, fees, inflation, and taxes. Compare daily, monthly, and annual compounding for your savings goals.
S&P 500: Total Return, Growth & Investment Simulator
Free S&P 500 calculator: project $10,000 or monthly contributions with dividends reinvested and inflation-adjusted returns.
S&P 500 DCA: Dollar Cost Averaging vs Lump Sum
Replay monthly S&P 500 investing since 1928 with dividends. Compare dollar cost averaging with investing the same money as a lump sum.