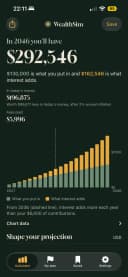
$10,000 put into the S&P 500 at the start of 2006 was worth $79,205 at the end of 2025, with dividends reinvested. That is 7.9 times the money, or 10.9% a year. After inflation it was $48,075 in 2006 dollars.
The figures replay the index's annual total returns from Aswath Damodaran's dataset at NYU Stern, which runs through 2025. They are the index itself: no fund fees, no taxes, and no selling in a panic.
$10,000 after 10, 20 and 30 years
| Invested | With dividends | Price only | After inflation | A year |
|---|---|---|---|---|
| 10 years ago (2016) | $39,339 | $33,492 | $28,697 | 14.7% |
| 20 years ago (2006) | $79,205 | $54,839 | $48,075 | 10.9% |
| 30 years ago (1996) | $187,103 | $111,141 | $88,578 | 10.3% |
The 20-year window includes the 2008 crash, when the index lost more than a third of its value in one year, and it still finished well ahead. The dividends matter more than most people expect. Over 20 years, price alone would have left you with $54,839.
Find your own start year
| Start of | Value at end of 2025 | After inflation | A year |
|---|---|---|---|
| 1996 | $187,103 | $88,578 | 10.3% |
| 1997 | $152,512 | $74,601 | 9.9% |
| 1998 | $114,581 | $57,002 | 9.1% |
| 1999 | $89,281 | $45,131 | 8.4% |
| 2000 | $73,856 | $38,336 | 8.0% |
| 2001 | $81,189 | $43,570 | 8.7% |
| 2002 | $92,103 | $50,193 | 9.7% |
| 2003 | $118,029 | $65,851 | 11.3% |
| 2004 | $91,954 | $52,268 | 10.6% |
| 2005 | $83,034 | $48,734 | 10.6% |
| 2006 | $79,205 | $48,075 | 10.9% |
| 2007 | $68,509 | $42,639 | 10.7% |
| 2008 | $64,947 | $42,072 | 11.0% |
| 2009 | $102,363 | $66,370 | 14.7% |
| 2010 | $81,282 | $54,136 | 14.0% |
| 2011 | $70,790 | $47,853 | 13.9% |
| 2012 | $69,335 | $48,258 | 14.8% |
| 2013 | $59,828 | $42,366 | 14.8% |
| 2014 | $45,275 | $32,542 | 13.4% |
| 2015 | $39,881 | $28,882 | 13.4% |
| 2016 | $39,339 | $28,697 | 14.7% |
| 2017 | $35,195 | $26,207 | 15.0% |
| 2018 | $28,942 | $22,005 | 14.2% |
| 2019 | $30,219 | $23,415 | 17.1% |
| 2020 | $23,031 | $18,253 | 14.9% |
| 2021 | $19,514 | $15,676 | 14.3% |
Start years close together can end far apart. Money that went in just before a crash spent its first years recovering, and money that went in at the bottom compounded from a low base. That is luck of timing, and nobody gets to pick it in advance.
To try a year or an amount that isn't in the table, open the S&P 500 calculator on the same 20 years and change the inputs.
What if you invested monthly instead?
Most people don't have $10,000 on day one. $100 a month over the same 20 years added up to $24,000 of your own money and grew to $105,948. Monthly buying spreads the timing risk: you buy some shares near the top and some near the bottom.
Was 20 years a good or a bad stretch?
A little better than usual. The long-run average from 1928 to 2025 is 10.0% a year. Since 1928, the worst 20-year window was 1929 to 1948 at 2.4% a year, and the best was 1980 to 1999 at 17.7%. No 20-year window has lost money. Ten-year windows are a different story: the worst one, 1929 to 1938, returned −1.7% a year.
For the year-by-year record, see S&P 500 historical returns. For how to buy the index today, see how to invest in the S&P 500.
Questions
How much would $10,000 invested in the S&P 500 20 years ago be worth today?
Invested at the start of 2006, $10,000 was worth about $79,205 at the end of 2025 with dividends reinvested, 10.9% a year. After inflation that is about $48,075 in 2006 dollars. The figures use the index's annual total returns (Aswath Damodaran, NYU Stern), before fees and taxes.
What about 10 and 30 years?
$10,000 invested at the start of 2016 reached about $39,339 by the end of 2025, and the same amount from the start of 1996 reached about $187,103, both with dividends reinvested.
Has the S&P 500 ever lost money over 20 years?
Not since 1928, with dividends reinvested. The worst 20-year window in the data was 1929 to 1948, at 2.4% a year. Shorter windows can and did lose money.
Do these figures include dividends and fees?
They include reinvested dividends and leave out fund fees and taxes. On price alone, the 20-year figure would be about $54,839 instead of $79,205. A low-cost S&P 500 fund charges a few hundredths of a percent a year, which changes the result only slightly.
Where to go next
- Replay any start year and amount: S&P 500 calculator
- Compare monthly investing with a lump sum: DCA calculator
- Project a VOO balance with its fee: VOO calculator
How we calculate: methodology and sources.
Past returns don't guarantee future results. This article is educational and is not financial advice.